Databases
SQL Server and MariaDB monitoring, from the slow query to the forgotten backup
The ERP crawls every day at around 11 am, the nightly backup has been failing for three weeks without anyone noticing, and the production database grows by 4 GB a month. FirstSI monitors your SQL Server and MariaDB instances, shows who is running what at the moment things jam, and tells you each morning what failed overnight.
Open-access demo, no sign-up: 138 fictional machines and all twelve modules.
BLOCKING one session blocking 14 others for 3 min, ERP database
SESSION export started from a computer in the accounts department
BACKUP payroll database: no full backup for 9 days
JOBS integrity check failed overnight
CAPACITY ERP database: 61% of disk, five months of headroom
What you can finally see
Slow queries, and who ran them
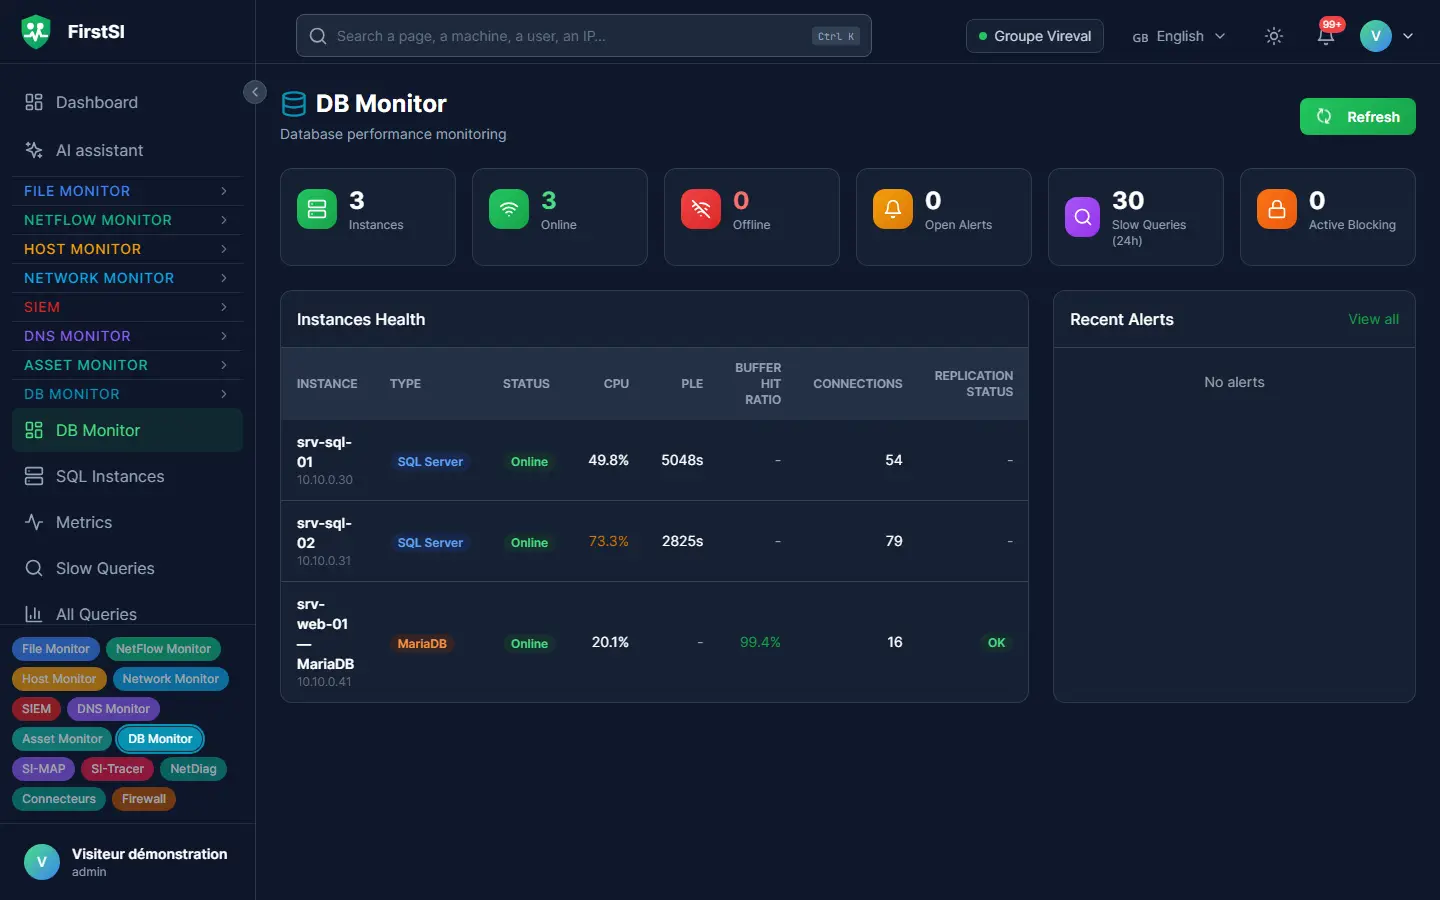
The most expensive queries, wait times and their causes, the health of each instance. You know which query is slowing the ERP down, and which computer it comes from.
Blocking chains
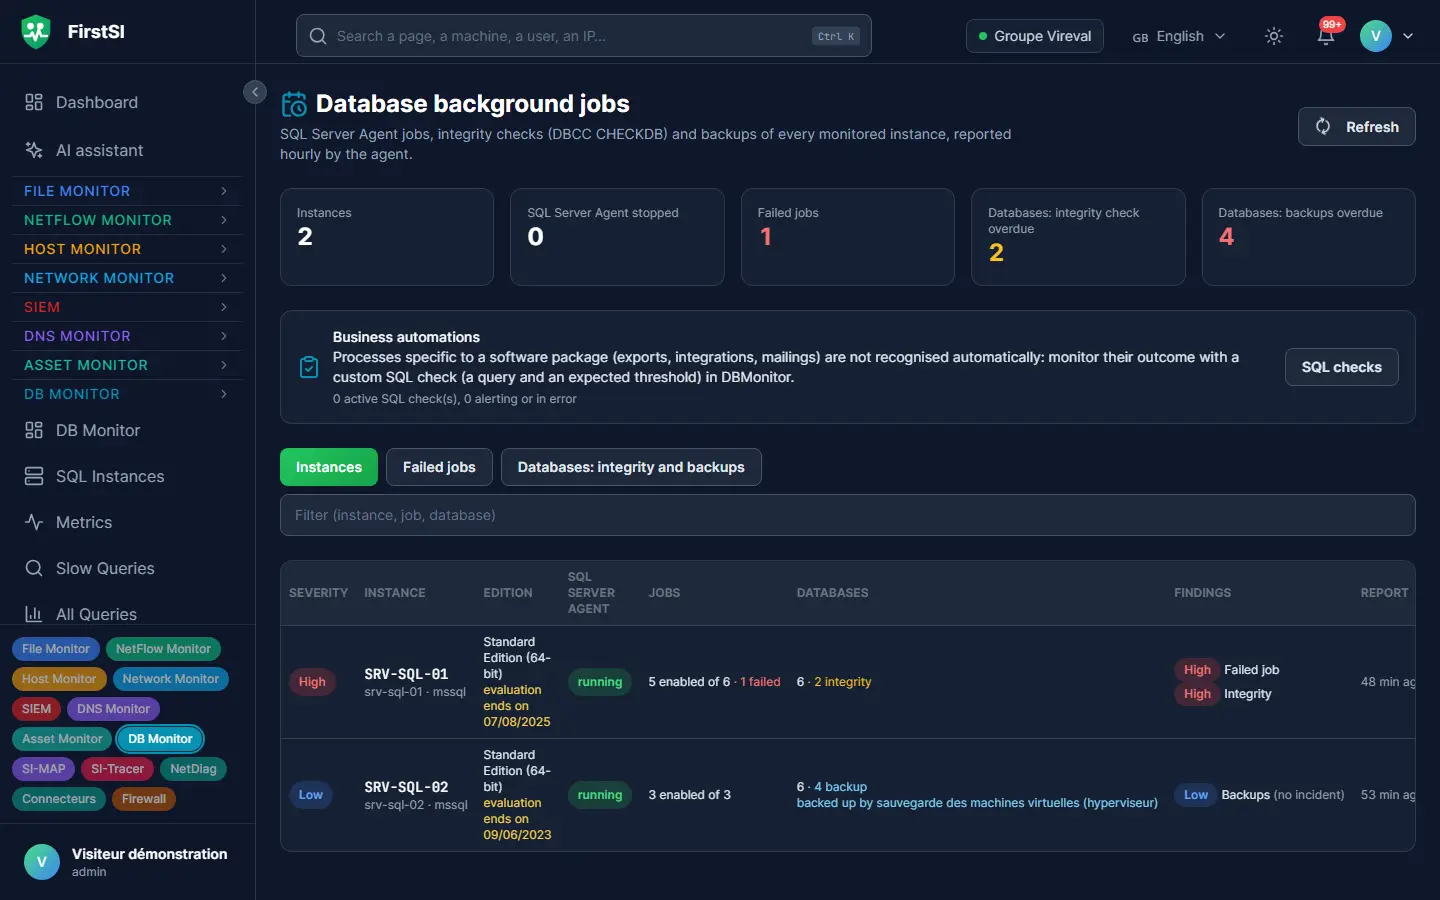
When one session blocks fourteen others, FirstSI shows the whole chain: who holds the lock, who is waiting, and since when. The “who is running what” view answers live.
Overdue backups
A database with no full backup for nine days shows up in red. You find out on an ordinary Tuesday, long before you have to restore anything.
Overnight jobs
Failed scheduled jobs, forgotten integrity checks, index maintenance that quietly stopped: whatever was failing each night appears in the morning summary.
Growth, forecast
The size of databases and logs is tracked, and disk saturation is forecast weeks ahead.
History that helps you understand
“It was slow yesterday around 11”: the history keeps the previous day's waits and queries. You can analyse after the event, without having had to sit in front of the screen.
In the console
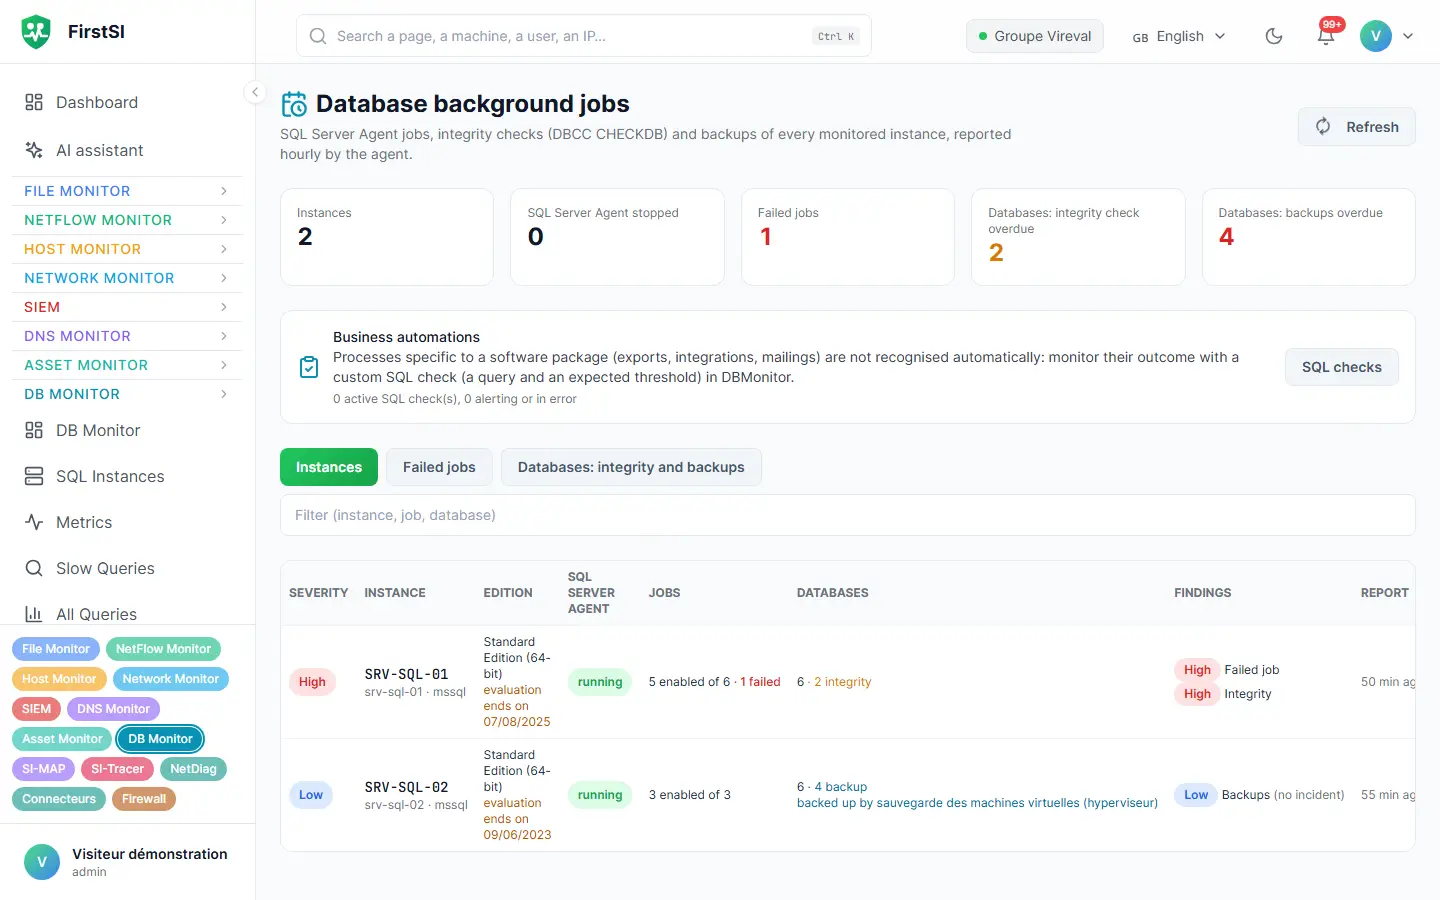
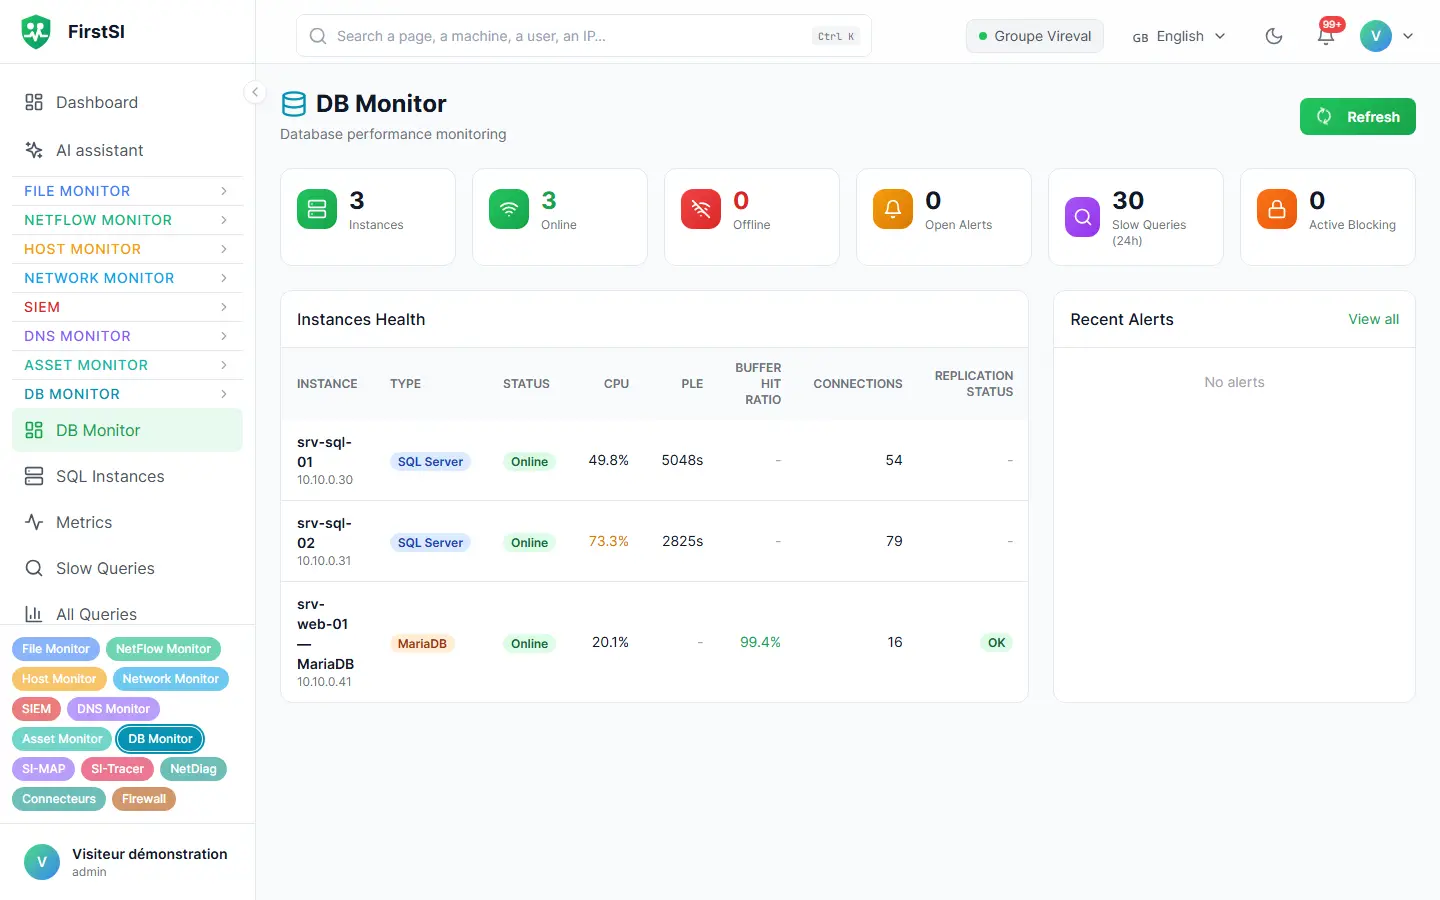
Screens from the live demo, with the data of a fictional company.
Every day, 11 am
The ERP that crawls when the orders come in
Every day at around 11 am, the sales team complains that order entry slows down for a quarter of an hour. The server is not overloaded and the network is fine.
The FirstSI blocking view shows the same scene every day. At 10:58 am, an export started from a computer in the accounts department locks the orders table, and fourteen sessions queue up behind it. The history confirms the pattern over the past three weeks.
The export is moved to 12:30 pm and rewritten so that it no longer locks the table. The next day, the wait-time curve is flat. Along the way, the morning summary told you that the payroll database had gone nine days without a full backup.
10:58 LOCK accounting export on the orders table
10:59 WAITING 14 sessions blocked behind it
11:13 RELEASED export finished, sessions resumed
HISTORY same scene on 15 working days out of 15
How it works
A read-only account
FirstSI connects to each instance with a read-only account, from the agent installed on the server or close to it.
Continuous readings
Performance, waits, sessions, scheduled jobs and backups are recorded continuously and kept as history.
The summary and the alerts
An alert when a backup is missing or blocking drags on, and each morning a summary of what happened overnight.
Frequently asked questions
Which databases are supported?
SQL Server and MariaDB, both followed in the same detail: performance, sessions, blocking, jobs and backups.
Does FirstSI change my databases?
No. It reads performance and status information with a read-only account and never touches the data.
Can I look back at yesterday's queries?
Yes, the history keeps expensive queries and waits. You can go back over a slowdown reported the day before.
What about my business applications, such as the ERP?
Connectors can also query the application itself, read-only, so that the AI assistant can cross-check its data with everything else.
What is the impact on performance?
Low. Readings are light and spaced out, designed to run in production all year round.
More questions about installation, hosting, GDPR or integrations? All frequently asked questions
Take it further
The same data serves more than one purpose. These pages show it from other angles.
Server security
Persistence, security status, capacity.
Learn more AI assistantAI assistant and ticket pre-diagnostics
AI on your premises, tickets already checked.
Learn more IT monitoringUnified IT monitoring
Twelve modules, one console, a single agent.
Learn moreIn the documentation
Stop finding out about a missed backup on the day you need to restore
In the demonstration, you will see the blocking view, the wait history and the morning summary on demonstration instances.